Pilot testing in research: trialling a questionnaire, sample size and checklist
A pilot test is a trial run of the questionnaire with experts and real people to fix problems before sending out hundreds of questionnaires. This article covers each stage, the sample size needed and how to read the results.
Quick summary
- A pilot test has 3 stages: expert review (CVI), cognitive interviews with 5–15 people, and a small quantitative trial survey.
- CVI: at least 3 experts; with up to 5 experts I-CVI must be 1,00, with 6–10 experts I-CVI ≥ 0,78; S-CVI/Ave ≥ 0,90.
- Trial survey: at least 30 people from the target population when developing a scale (Johanson & Brooks, 2010).
- Read completion time, drop-out rate, skipped questions, floor/ceiling effects above 15% and items with almost no variance; Cronbach's Alpha is only preliminary.
- Rehearsing the data workflow with test responses only catches technical errors; it never replaces real respondents and must never be reported as data.
What a questionnaire pilot test checks
A pilot test is a small-scale run of the questionnaire before main data collection. The goal is not research results but finding problems while fixing them is still cheap. Dillman et al. (2014) recommend combining several kinds of pre-testing, since each catches different problems. A good pilot answers six questions:
- Wording: do respondents understand the question the way you intend?
- Length: how long does it take, and is it too long?
- Order: does the question order cause fatigue or lead answers?
- Branching: does each group of respondents reach the right sections?
- Data pipeline: is the data from Google Form to Sheet to SPSS in the right format?
- Feasibility: can you reach the population, and what is the valid-response rate?
In Vietnamese theses
Nguyễn Đình Thọ (2011) describes a process with a preliminary and a main study. The preliminary study usually has two parts: qualitative preliminary research (discussions with experts and in-depth interviews to adjust the scales) and quantitative preliminary research (a small-sample survey to assess the scales preliminarily). The three stages below match this split: stages 1 and 2 are qualitative, stage 3 is the quantitative preliminary.
Stage 1: expert review and the CVI
Invite experts (lecturers, practitioners in the field) to rate how relevant each item is to the construct on a 4-point scale: 1 = not relevant, 2 = needs major revision, 3 = relevant but needs minor revision, 4 = highly relevant. From this, compute the content validity index (CVI):
- I-CVI of an item = number of experts rating 3 or 4 / total experts.
- S-CVI/Ave of the whole scale = the mean of the I-CVIs.
Per Lynn (1986), at least 3 experts are needed; with 5 or fewer experts I-CVI must be 1,00, with 6–10 experts I-CVI must not be below 0,78. Polit & Beck (2006) suggest an S-CVI/Ave of 0,90 or above and stress reporting which method was used.
| Question | Scores from 6 experts | Number rating 3–4 | I-CVI | Conclusion |
|---|---|---|---|---|
| Q1 | 4, 4, 3, 4, 3, 4 | 6 | 1,00 | Keep |
| Q2 | 4, 3, 3, 4, 4, 3 | 6 | 1,00 | Keep |
| Q3 | 4, 4, 2, 3, 4, 3 | 5 | 0,83 | Keep, see comments |
| Q4 | 3, 2, 4, 2, 3, 4 | 4 | 0,67 | Revise or replace |
| Q5 | 4, 4, 4, 3, 4, 4 | 6 | 1,00 | Keep |
S-CVI/Ave = (1,00 + 1,00 + 0,83 + 0,67 + 1,00) / 5 = 0,90 (exactly 4,5 / 5 as a fraction). The scale just meets the overall threshold, but Q4 is still below 0,78 and must be revised. Don't let an average hide a weak item.
Stage 2: cognitive interviews
A cognitive interview shows what respondents think when reading a question. Willis (2005) describes two main techniques, usually done in rounds of about 5–15 people, revising the questionnaire between rounds:
- Think-aloud: participants say what they are thinking as they answer.
- Verbal probing: the interviewer asks follow-up questions after each question or at the end.
Some sample probes:
- "What do you understand by 'digital experience' in this question?"
- "Can you say this question in your own words?"
- "Why did you choose level 4 and not level 5?"
- "Was there an answer you wanted to choose but couldn't find?"
- "Which question made you reread it or find it hard to answer honestly?"
Choose participants from the survey population, not your research teammates. Record each problem by item code to put into the change log.
Rehearsing the data workflow before the trial survey
Before sending the form to real people, make sure the technical system works. A branching or coding error found after 30 people have answered ruins the whole pilot round.
- Walk through every branch: use Preview and send test responses for every choice set to "Go to section based on answer". How to set this up is in the article building a proper Google Form survey.
- Check the exported Sheet: column order, checkbox questions combining several answers in one cell, multiple choice grids exporting text labels instead of numbers.
- Check the SPSS coding: trial the coding syntax, reverse negative items, assign value labels. The classic mistake is using
Transform → Automatic Recode, which numbers alphabetically, so "Đồng ý" (Agree) may get a lower code than "Hoàn toàn không đồng ý" (Strongly disagree). The detailed process is in the article export Google Form data to SPSS. - Trial the analysis script to the last step to make sure every variable is present.
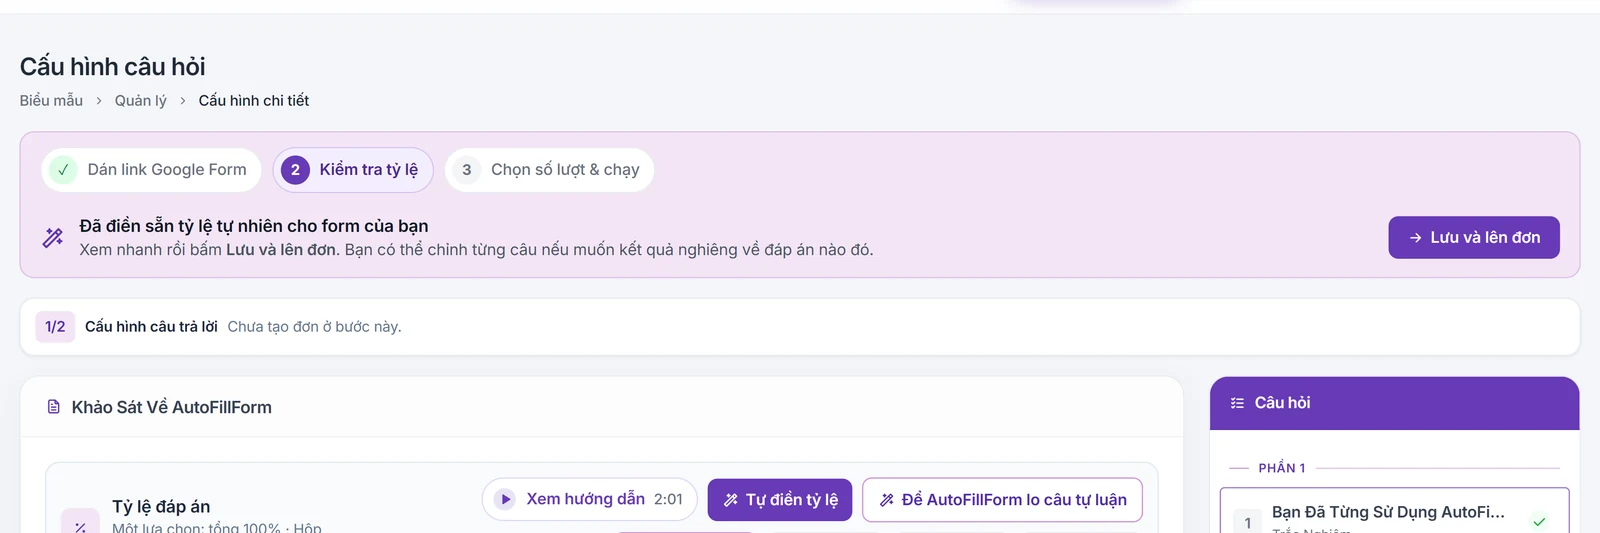
When you need many test responses across every branch, Google Form Auto Filler of AutoFillForm can read the form structure and send responses from your settings. To rehearse the analysis, SPSS research module generates simulated Likert data and exports .sps syntax.
Stage 3: quantitative trial survey
Trial survey sample size
Johanson & Brooks (2010) recommend at least 30 people from the target population for initial scale development. Hertzog (2008) shows reasonable pilot sizes range from about 10–40 per group depending on the purpose: feasibility checks need fewer, parameter estimation more. A pilot is not for hypothesis testing, so don't compute power for it. For the main sample size, see the article how to calculate sample size.
Indicators to read
| Indicator | How to measure | Signs to review |
|---|---|---|
| Completion time | The median, since a few people leaving the form open for a long time skew the mean | Far longer than the time stated in the invitation |
| Drop-out by section | Number of people stopping at each section | A section where drop-outs spike |
| Skipped questions | Blank rate on optional questions | One question skipped far more than the others |
| Floor/ceiling effects | Share of people at the lowest or highest possible score | Over 15% of respondents (Terwee et al., 2007) |
| Item variance | Standard deviation, frequency distribution | Almost everyone chooses the same level |
| Preliminary Cronbach's Alpha | Alpha and item-total correlations | Negative correlations, usually from forgetting to reverse negative items |
Google Forms only stores submitted responses and the submission timestamp, not the start time or abandoned forms. So time and drop-out should be measured by directly observing some participants, asking them to note their start time, or comparing invitations with responses received. To see skipped questions, don't make every question Required in the pilot round.
The 15% threshold of Terwee et al. (2007) is proposed for a scale's total score; for individual Likert items use it as a signal to review, not a reason to drop. Cronbach's Alpha at n = 30 fluctuates a lot between samples, so don't delete items just to raise pilot alpha. How to read it fully is in the article Cronbach's Alpha trong SPSS.
Feedback question at the end of the questionnaire
Add an optional Paragraph question at the end of the pilot form: "Was any question hard to understand or answer, or missing a suitable choice? Please note the question number and why." It usually points to exactly where the quantitative indicators only hint.
The change log and merging pilot data
Every change after the pilot should go into a change log, since committees often ask "how was the scale adapted from the original".
| Item code | Problem | Evidence | Edit | Version |
|---|---|---|---|---|
| Q4 | Experts say it measures two ideas in one item | I-CVI = 0,67 | Split into Q4a, Q4b | v2 |
| Q12 | Respondents understand "digital platform" differently | 3/8 people in cognitive interviews | Add an example in brackets | v2 |
Can pilot data be merged into the main sample?
Generally not if the questionnaire changed, even only the wording, since the two groups answered two different instruments. Even with no changes, the safest way is to keep pilot data separate and report it clearly. Also exclude pilot participants from the main round so they don't answer from memory.
Questionnaire pilot test checklist
- At least 3 experts rated the items; every item meets the I-CVI threshold and S-CVI/Ave ≥ 0,90.
- Cognitive interviews with 5–15 people from the population done, items revised and rounds repeated if needed.
- Every branch walked through; Sheet, SPSS coding syntax and analysis script checked.
- All test responses deleted and a new Sheet created before opening the form to real people.
- Trial survey run with at least 30 people from the target population.
- Completion time, drop-outs, skipped items, floor/ceiling, variance and preliminary alpha read.
- Change log kept and questionnaire versions numbered.
- Decided and stated that pilot data is kept separate.
- Valid-response rate estimated to work out how many questionnaires to send.
Frequently asked questions
References
- Dillman, D. A., Smyth, J. D., & Christian, L. M. (2014). Internet, phone, mail, and mixed-mode surveys: The tailored design method (4th ed.). Wiley.
- Hertzog, M. A. (2008). Considerations in determining sample size for pilot studies. Research in Nursing & Health, 31(2), 180–191.
- Johanson, G. A., & Brooks, G. P. (2010). Initial scale development: Sample size for pilot studies. Educational and Psychological Measurement, 70(3), 394–400.
- Lynn, M. R. (1986). Determination and quantification of content validity. Nursing Research, 35(6), 382–385.
- Nguyễn Đình Thọ. (2011). Phương pháp nghiên cứu khoa học trong kinh doanh [Scientific research methods in business]. Labour – Social Publishing House.
- Polit, D. F., & Beck, C. T. (2006). The content validity index: Are you sure you know what's being reported? Critique and recommendations. Research in Nursing & Health, 29(5), 489–497.
- Terwee, C. B., Bot, S. D. M., de Boer, M. R., van der Windt, D. A. W. M., Knol, D. L., Dekker, J., Bouter, L. M., & de Vet, H. C. W. (2007). Quality criteria were proposed for measurement properties of health status questionnaires. Journal of Clinical Epidemiology, 60(1), 34–42.
- Willis, G. B. (2005). Cognitive interviewing: A tool for improving questionnaire design. SAGE Publications.
The thresholds in this article are common conventions in the sources above. Check them against your supervisor's or target journal's requirements.